In April we argued that the value in AI was migrating down the stack, away from the application layer and toward the compute beneath it: semiconductors, memory, manufacturing equipment, the physical machinery of intelligence. That thesis still holds. But the binding constraint has already moved one layer deeper. It is no longer the chip. It is the electron.
The clearest proof is in what the money is buying. In the first weeks of 2026 the four largest hyperscalers, Amazon, Alphabet, Microsoft and Meta, guided investors to roughly $700 billion of combined capital expenditure this year, close to double their 2025 spend. Microsoft guided to about $190 billion, flagging that roughly $25 billion of that is component-price inflation rather than new capacity. Amazon held its $200 billion February forecast. Alphabet raised guidance to $175 to 185 billion. Meta guided $115 to 135 billion. Each of the four now spends more than $100 billion a year, at capital intensity of 45 to 57% of revenue, levels that would have read as reckless five years ago.
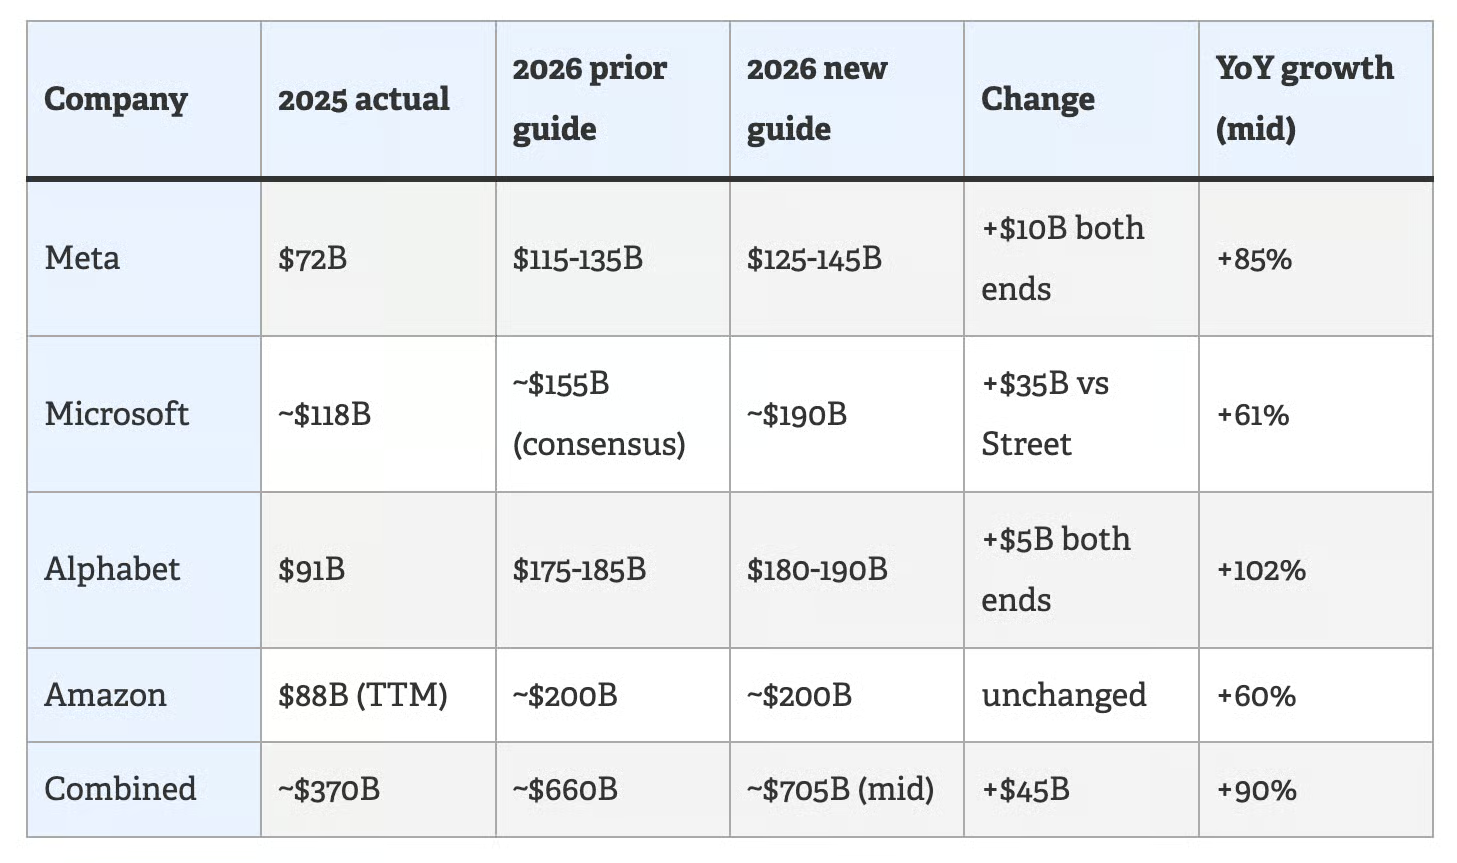
The size of the spend matters less than what it reveals. Microsoft is sitting on an $80 billion backlog of Azure orders it cannot fulfil, and what is holding it back is not chips, it is power. When a company like Microsoft runs short of power before it runs short of silicon, the bottleneck has plainly moved.
So the question this letter asks is the one April set up: if compute was last year's scarcity, what is the scarcity now, who controls it, and where does the investable value sit? The answer is the boring, capital-heavy layer almost nobody was modelling a year ago: generation, grid connection, storage, cooling, and the software that orchestrates them.
The demand curve underneath AI
The scale is hard to overstate. In its 2026 update to the Energy and AI analysis, the IEA estimates global data-centre electricity use at roughly 485 TWh in 2025, already comparable to a mid-sized industrial economy, and projects it will roughly double to around 950 TWh by 2030, about 3% of world electricity demand. Crucially, demand from AI-focused data centres triples over that window, growing several times faster than the rest of the sector.
The load is also intensely local. The IEA's 2025 Energy and AI report notes the United States, China and Europe accounted for about 85% of consumption, and that in the US data centres are on course to consume more electricity by 2030 than the production of aluminium, steel, cement and chemicals combined. Lawrence Berkeley National Laboratory puts US data-centre demand at up to 6.7 to 12% of national electricity by 2028. In Ireland, data centres already draw over a fifth of national power.
.avif)
Demand is doubling on a five-year clock; the grid does not. New high-voltage infrastructure takes the better part of a decade to permit and build. That mismatch, fast, concentrated, inflexible demand meeting slow, shared, capital-rationed supply, is where the entire investment thesis lives.
.avif)
Three ways to power an AI data centre, and why the difference is investable
AI facilities are not all powered the same way, and the choice of architecture drives everything an investor cares about: cost, how fast it can be switched on, how resilient it is, and how exposed it is to regulators. Three models are competing for the same demand right now, and capital is moving between them in real time.
Model 1: Grid-connected, the incumbent that is running out of room
All power drawn from the local utility, with diesel or batteries for backup. Still dominant, increasingly constrained. In Europe's major hubs, interconnection waits now run the better part of a decade, against build times of roughly two years. The grid is not disappearing, but on its own it can no longer keep pace with AI deployment timelines.
Model 2: Behind-the-meter, where the capital is moving fastest
Generate power on-site and bypass the interconnection queue entirely. McKinsey work cited by Jefferies suggests a quarter to a third of incremental data-centre demand to 2030 could be met behind the meter. A Bloom Energy survey found the share of operators planning to run entirely on on-site power by 2030 jumped from just 1% in 2024 to 27% a year later. The appeal is time-to-power: a behind-the-meter site can be energised years ahead of one waiting in a queue.
The deal flow confirms it. GE Vernova raised full-year guidance in April 2026 on the back of data-centre demand and expects to reach 20 GW of annualised gas-turbine output by Q3; it booked more electrification orders from data centres in Q1 alone than in all of 2025. Brookfield committed up to $5 billion to deploy Bloom Energy's solid-oxide fuel cells at AI sites. Amazon, Google and Microsoft are each backing small modular nuclear ventures.
.avif)
Model 3: Hybrid microgrid, the priciest option and the deepest moat
Grid plus on-site generation plus storage, knitted together by an intelligent controller that can island during outages, optimise across sources in real time, and sell flexibility back to the utility. The most capital-intensive option, but the software layer that orchestrates multi-source power is the most defensible capability in the stack, and the hardest to commoditise.
Why AI loads break the old playbook
The thesis only works if you understand why AI loads are structurally unlike anything the grid was built to serve. The differences are not marginal; they reshape the whole energy architecture.
Training runs GPU clusters near maximum utilisation around the clock, for days or months. The load is essentially flat, a load factor near 0.85 to 0.95 versus 0.3 to 0.5 for a traditional enterprise facility. That looks like baseload, which utilities like. But a single interruption during a large run can force a restart costing millions, so instantaneous backup is non-negotiable.
Inference is the opposite problem: variable, demand-following, prone to sudden spikes when a model goes viral. It needs not just more power but more flexible power, fast-ramping and peak-absorbing. And large clusters switching together can swing demand by tens of megawatts within seconds, threatening voltage stability on the local grid. Fast-response backup with voltage support stops being a nice-to-have.
.avif)
The punchline for the next decade comes from JLL-style sector forecasts: as AI shifts from a training-dominated to an inference-dominated workload, the power profile flips from flat baseload to volatile, spike-prone demand. The energy solutions that win the training era are not automatically the ones that win the inference era.

The backup stack is itself an asset class
AI sites do not just need primary power; they need a layered backup architecture spanning millisecond response to multi-day endurance. Each layer is a distinct market.
- Layer 0: Ride-through, milliseconds.
Capacitors and fast UPS smoothing micro-interruptions. - Layer 1: Bridge, minutes.
Batteries (BESS) as the critical first responder. - Layer 1b: Extended bridge, up to hours, sub-50ms start.
Grid-scale BESS, the fastest-growing segment of the stack. - Layer 2: Sustained, days.
Diesel or gas reciprocating engines, slower to start, effectively unlimited with refuelling. - Layer 3: Endurance logistics.
The refuelling chains that keep generators running through prolonged outages.
Think of backup power as a relay race, not a single runner. The moment grid power wobbles, something has to carry the load instantly, then hand off to the next system, and the next, each built for a longer leg of the outage. Capacitors and fast UPS cover the first milliseconds. Batteries take the next few minutes. Grid-scale storage extends that to hours. Generators carry it for days, and behind them sits the fuel-supply chain that keeps those generators running. Each handoff is a distinct piece of equipment, a distinct cost, and a distinct market.
Batteries deserve special attention. They respond in milliseconds, bridge the gap until a generator reaches full output, smooth fast GPU ramp events, and in utility markets offset demand charges and earn ancillary-service revenue. Estimates of the data-centre power-systems market vary widely, but one widely cited forecast puts it at roughly $24 billion in 2026 rising to about $56.5 billion by 2034, around 16% CAGR, with BESS, fast-start gas and power-management software the fastest-growing pieces. Treat the absolute number with caution; the direction of travel is the signal, not the decimal.
The European question: €176 billion committed, but can the grid take it?
Europe's data-centre market is, in the words of the EUDCA's 2026 State of European Data Centres report, entering a pivotal phase. The association forecasts €176 billion of cumulative investment from 2026 to 2031, but warns explicitly that future growth will be capped by grid readiness, not capital. IT power capacity already grew from 10,539 MW in 2023 to 14,784 MW in 2025, ahead of forecast.
.avif)
This is the same tension May's letter drew out in public markets, capital arriving faster than the underlying plumbing can absorb it, now playing out in physical infrastructure. The capital is willing. The grid is the gate.
.avif)
The response is geographic. As the traditional FLAP-D hubs, Frankfurt, London, Amsterdam, Paris, Dublin, hit queue and permitting limits, capital is decentralising toward the Nordics with their cheap hydro and free cooling, Iberia, Central and Eastern Europe and Tier-2 metros. Ireland has effectively gated new connections on matching dispatchable power; the Netherlands has added zoning limits. Regulation is also tightening efficiency: the EU's reporting regime and national PUE rules are pushing the market toward cleaner, denser builds faster than in the US.
The risk cuts both ways. The €176 billion forecast assumes the infrastructure can be built. The interconnection data suggests much of it cannot, at least not in the markets where demand is highest. If Europe cannot fix queues and permitting, the capital will simply go elsewhere.
Where this thesis breaks
Any honest version of this story names its own failure modes, and the most interesting risks are the ones the capital is not yet pricing.
- The grid cannot be bypassed forever.
Behind-the-meter gas relieves the queue but collides head-on with decarbonisation pledges. The hyperscalers selling net-zero are the same firms ordering gas turbines booked solid through 2028. That tension is unresolved, and it is political as much as technical. - The nuclear timeline is a promise, not a delivery.
Every hyperscaler has an SMR commitment; none has operational SMR power at a data centre. Realistic timelines are 3 to 5 years at best. If one project lands on schedule it resets the market, but betting on schedule has historically been a way to lose money in nuclear. - Community and permitting risk is real and rising.
Local opposition, water use and grid-cost socialisation are turning into the binding political constraint in exactly the markets with the most available capacity. Speed-to-power assumptions die in planning hearings. - The market-size numbers are soft.
Estimates for the same market diverge by billions depending on definitions. Underwrite the trend; distrust any single forecast quoted to the decimal.
What this means for VCs and founders
Three layers to keep in mind:
- Hardware-adjacent.
Turbines, fuel cells, BESS, transformers, switchgear, cooling. The market is real: GE Vernova booked more data-centre electrification orders in Q1 2026 alone than in all of 2025, and transformer lead times have stretched to 128 weeks. But it is incumbents' territory: GE Vernova, Schneider, Eaton, Caterpillar, Bloom. The venture opening is the next generation, solid-state transformers, new battery chemistries, SMRs, advanced liquid cooling, where AI's density demands outrun what current products deliver. - Software and controls.
Microgrid controllers, power-management platforms, load optimisation, predictive maintenance, demand-response, energy trading. The data-centre power-systems market is forecast to roughly double from $24bn in 2026 to $56.5bn by 2034, with software the fastest-growing piece. This is where defensible margin lives: orchestrating multi-source power at millisecond response is a venture-scale software problem. - Infrastructure services.
Site selection, interconnection consulting, behind-the-meter development, power-as-a-service, procurement. With European interconnection waits running 5 to 10 years and a quarter to a third of incremental data-centre demand to 2030 expected to be served behind the meter, whoever can secure power-ready sites on a compressed timeline captures real value.
What we are watching next
This is the largest infrastructure cycle since the late-1990s telecoms build, with very different physics underneath. We are watching:
- Behind-the-meter adoption.
Whether the 25 to 33% forecast survives permitting, community opposition and emissions pledges. The speed-versus-decarbonisation tension is live. - Grid-scale BESS at data centres.
The fastest-growing component. Watch for dedicated data-centre BESS products and co-located storage-plus-generation models. - Small modular reactors.
Still 3 to 5 years out at best. The first on-schedule delivery resets expectations for everyone. - European grid reform.
The €176bn forecast depends on solving interconnection queues. Watch policy in Germany, Ireland, the Netherlands and France. - Power-management software.
The least visible, potentially highest-margin layer. Watch for venture-backed entrants. - The inference and training mix.
As inference overtakes training, the power profile flips from flat to spiky, changing which solutions win.
The hyperscaler capex numbers make the headlines. The energy infrastructure underneath them makes the returns.
First appeared in our newsletter, June 2026.